The visualized data is strong with them
Posted by magazine
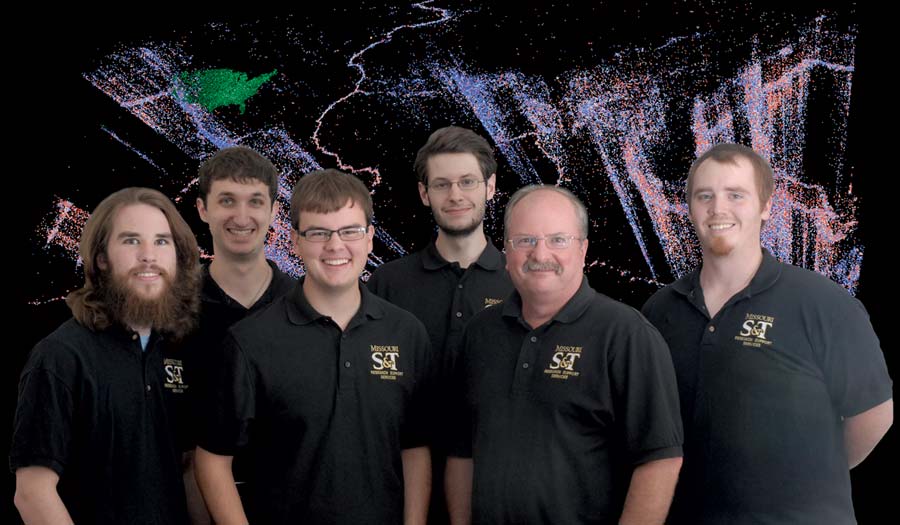
Members of the 2013 V4DiR Team are, from left: Nathan Jarus, David Zemon, Nick Eggleston, Robert Higgins, Mark Bookout and Travis Bueter.
Members of the 2013 V4DiR Team are, from left: Nathan Jarus, David Zemon, Nick Eggleston, Robert Higgins, Mark Bookout and Travis Bueter.
Making sense of ever-increasing mounds of data is a huge challenge facing researchers today. But staff and students in Missouri S&T’s information technology department have come up with a way to help researchers make sense of all that information by turning it into 3-D visualizations.
Make that 4-D visualizations, because the tool created by IT’s research support services team at S&T shows 3-D imagery over time.
The tool is called Visualizing Four Dimensions in Rolla, or V4DiR for short. The IT folks call it “Vader,” as in Darth. But unlike Luke Skywalker’s Star Wars nemesis, V4DiR sheds light, not darkness, by letting researchers see their data in 3-D over various time spans.
On campus, RSS director Mark Bookout and his team have been demonstrating V4DiR’s power by showing researchers maps-in-motion of natural disasters: all of the world’s earthquake occurrences from 1920 through 2012 as well as tornado activity in the U.S. since 1950. The earthquake data is also being used by Stephen Gao, a professor of geology and geophysics who is studying seismic activity in the Horn of Africa region.
That on-screen loop of information can be manipulated to help researchers home in on specific data points. For instance, the visualization can be tilted on an axis to provide greater levels of depth or various angles. Or it can be stopped if researchers want to examine data from a particular time frame.
“We can pinpoint exactly where on the earth, as well as how deep within the earth, an earthquake has happened,” says Nick Eggleston, a junior computer science major who leads the project.
“V4DiR has the potential to enhance any sort of research,” Bookout says. “It allows us to use our natural pattern-recognition capabilities to isolate interesting groupings of information. And our association with vendors ensures that we have enough computing horsepower to build and display very large data sets in quick order.”